Trade better.Become consistentlyprofitable.
Trakfinity is the trading journal and performance tracker that turns every logged trade into analytics, risk insight and a discipline score — so you review your process, not just your P&L.
7-day free trial; a card or another supported payment method is required at checkout; your first £5/month charge (or the local-currency equivalent shown at checkout) is due when the trial ends; cancel any time before then from your account settings.
$57,783.26
+15.57%
Good evening
Demo – Futures
Equity
$57,783.26
+15.57% all time
Today
+$264.52
1 trade logged
Net P&L
+$7,783.26
77 trades total
Streak
1 day
Green run
Today
+$264.52
1 trade logged · 7-day +$2,648.00
Equity curve
+$7,783.26
Risk rule respected on 1 trade today · Example data
Import from the platforms you already use — direct sync for Binance, Bybit and OANDA, CSV import for everything else
12
Analytics modules
Journal, risk, sessions, psychology
7
Built-in rule templates
Feed your discipline score
4
Asset classes
Futures, forex, stocks, crypto
3
Base currencies
GBP, USD and EUR accounts
Dashboard
Your whole trading day on one screen.
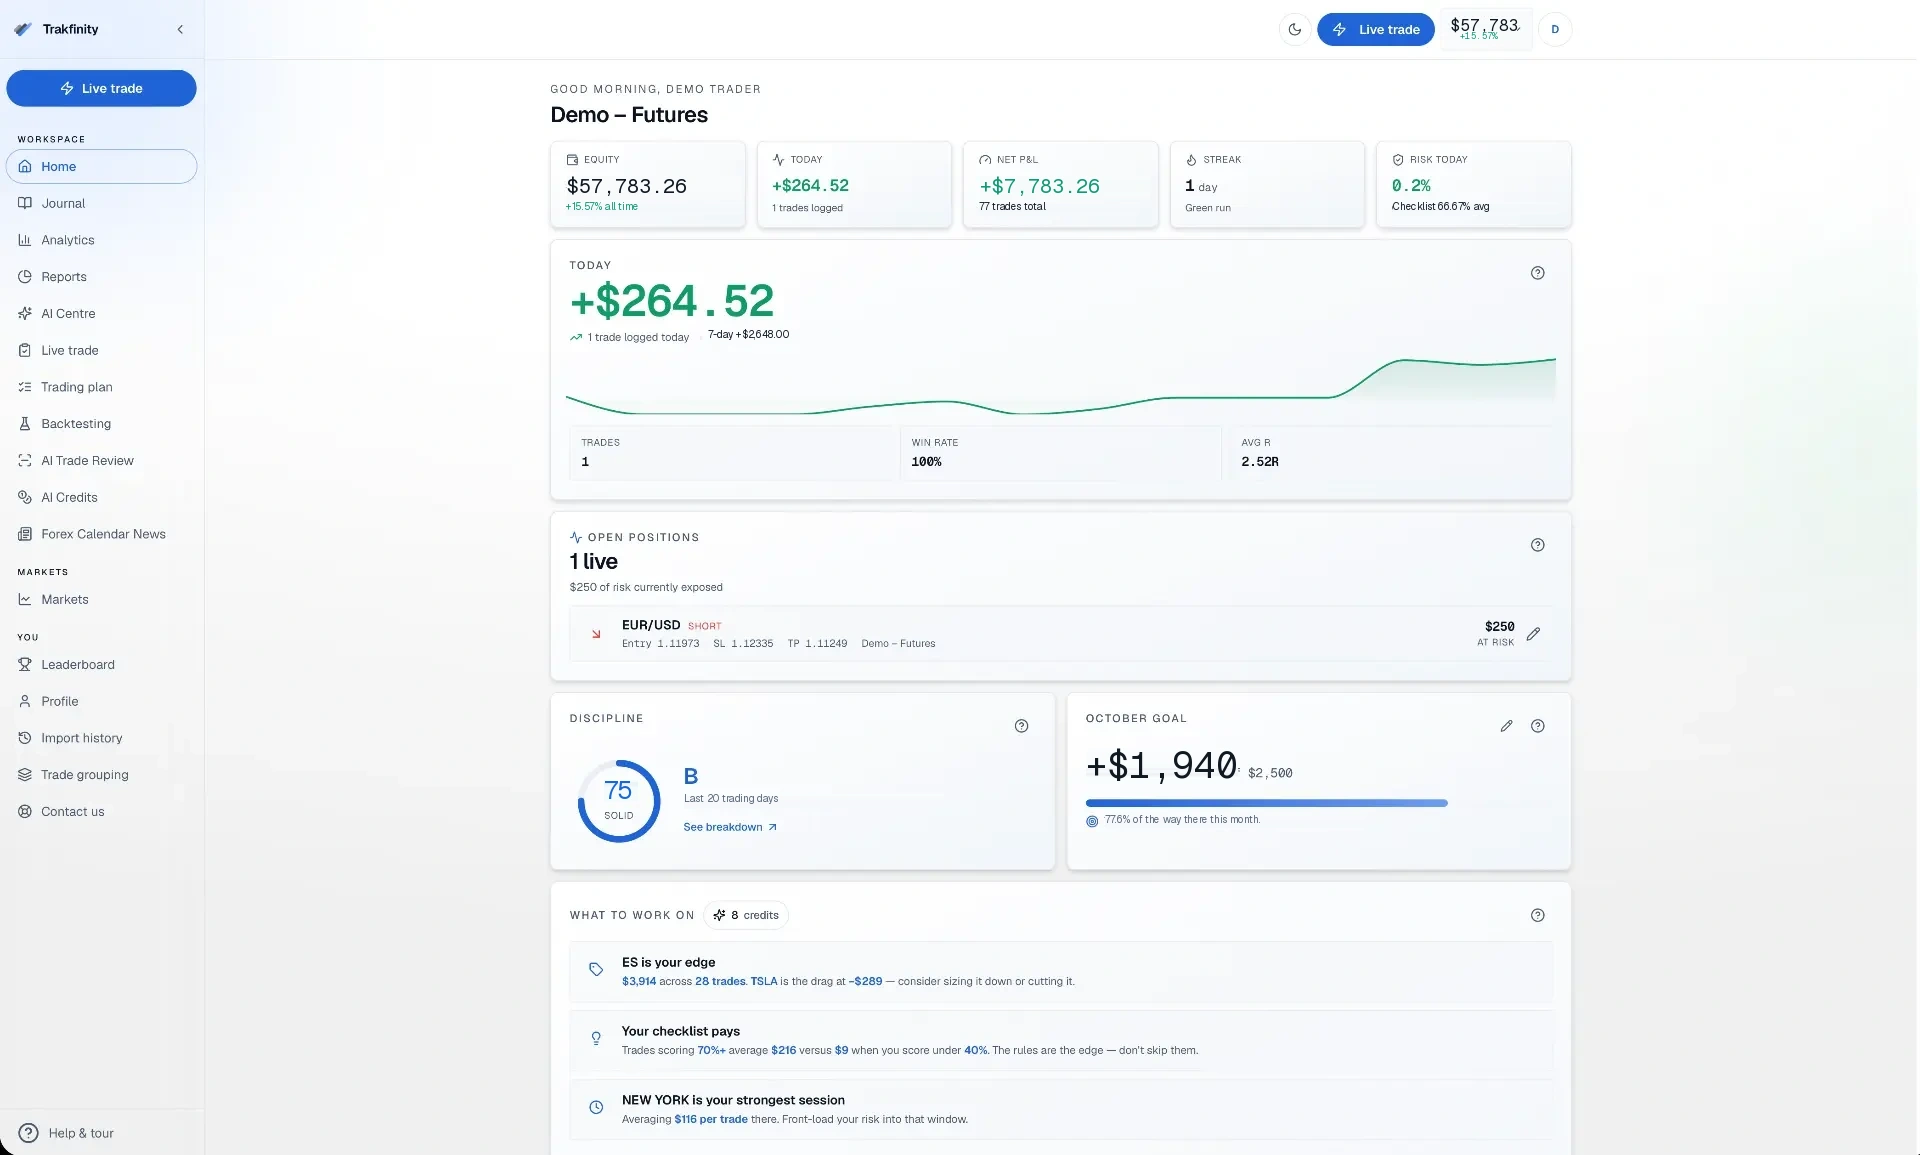
Open the dashboard and see your equity, today's net P&L after fees, win rate and current streak at a glance. Your discipline score sits beside the numbers, and the AI Coach summarises what is working and what is costing you. Every figure updates the moment you log or sync a trade, across every account you run.
Journal
Every trade, with the story behind it.
The journal lists every trade with its symbol, direction, size, P&L and R multiple. Open one and its chart screenshots, notes, setup, mistake and emotion tags and entry checklist results are all on the same record. Filter by account, date, tag or setup to find the trades worth studying, and search them any time you want to look back.
Calendar
Spot the overtrading before it costs you.
The calendar lays out every trading day with its profit or loss and the rule checks behind it, so a good or bad month reads at a glance. Beside it, the consistency heatmap counts how often you traded each day — the darker the red, the more trades — so the days you overtraded stand out immediately. Both are built from your own closed trades.
Analytics
Find where your edge really comes from.
Reports break your P&L down by hour, weekday, session, setup and symbol, so you can see which conditions pay and which quietly drain the account. Win rate, profit factor, expectancy and average R sit alongside each breakdown, and every formula is shown so you know exactly how each number was calculated from your own closed trades.
AI Coach
Your costliest habits, ranked.
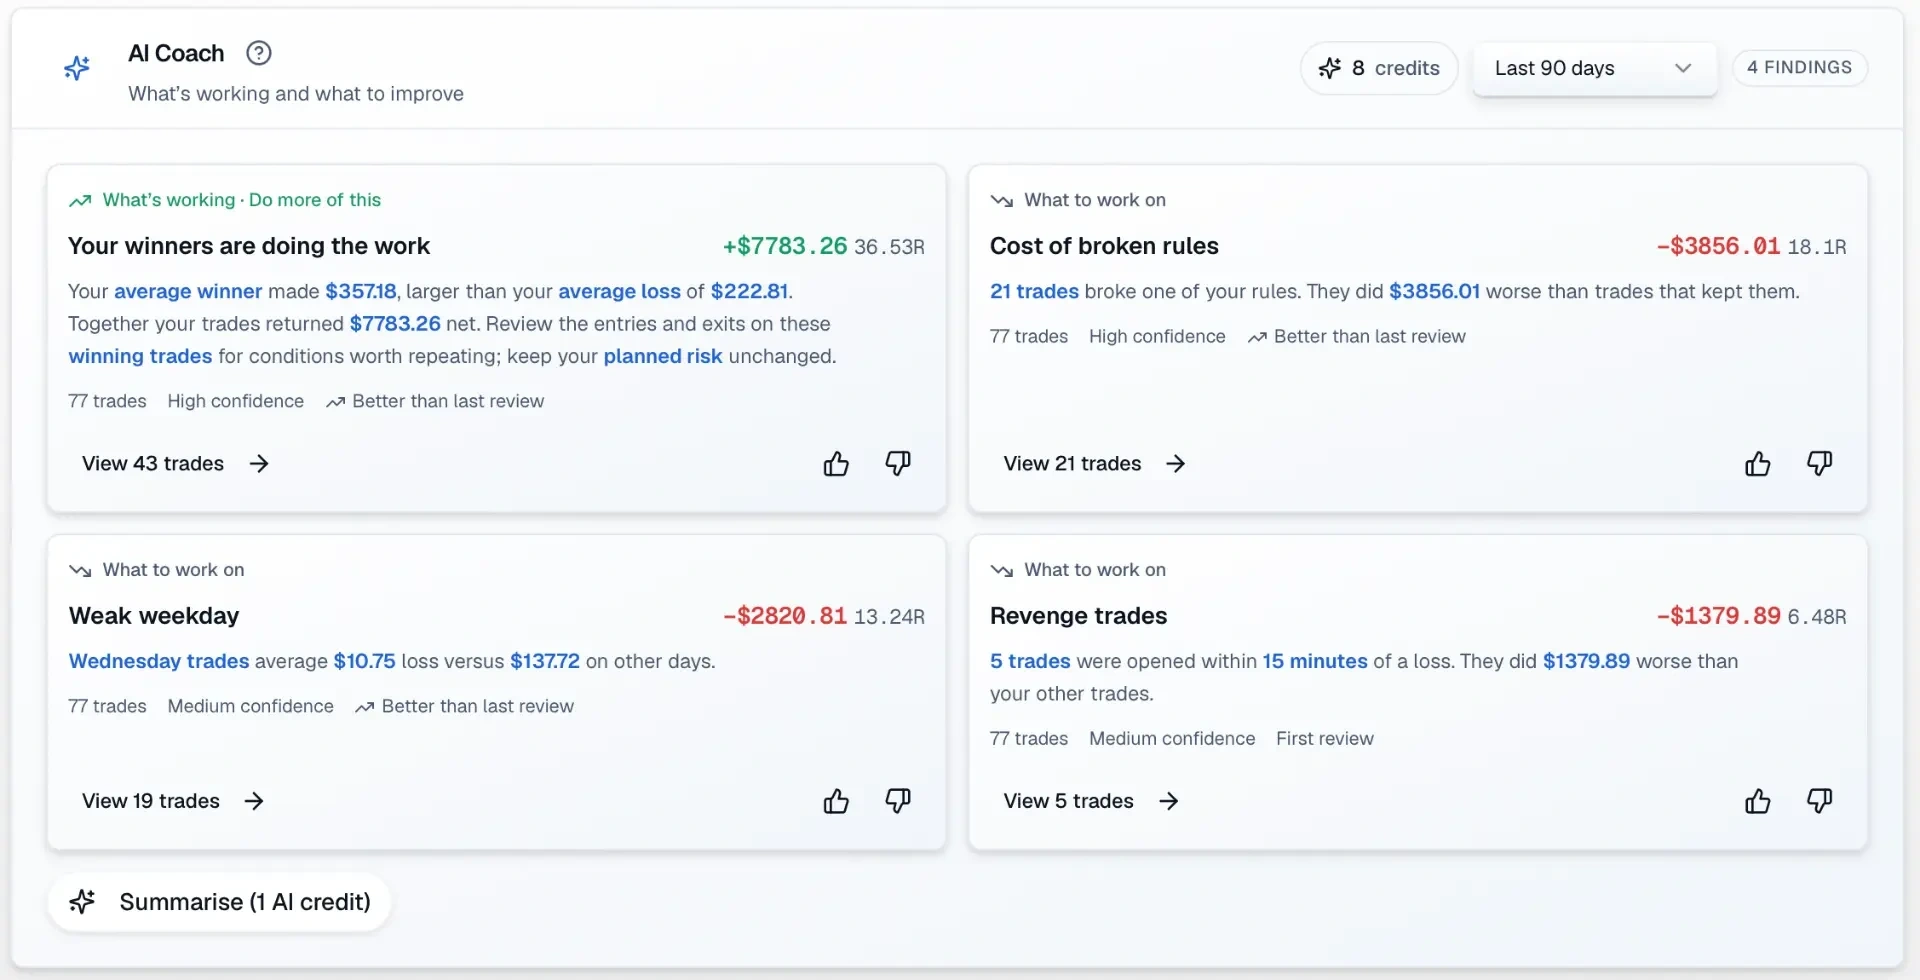
The AI Coach reads your logged trades and ranks the habits costing you the most, with the evidence behind each one: how often it happened and what it cost. It also points out the strengths worth repeating, so feedback stays balanced. Each insight ends with one specific change to try in your next sessions, based only on your own record.
AI Trade Review
Upload a chart. Get a straight answer.
Drop in a chart screenshot and AI Trade Review reads the entry, stop loss, take profit and exit from the price scale. You get a structured review of the setup, how the trade was managed and how it was closed, then the single change with the biggest expected payoff. Detected values are shown so you can check them before saving.
Live trade
Check your plan before you click buy.
Live trade sizes the position from your risk and stop, shows the risk-to-reward and walks you through the entry checklist for your setup. The Rules right now strip checks today's closed trades against your rules and warns you before you break one, so the decision to take or skip a trade happens while it still matters.
Markets
Watch the market and your own record on it.
Markets gives you full TradingView charts for stocks, futures, forex and crypto, with timeframes, indicators and drawing tools. Pick a symbol from your watchlist and Trakfinity shows how you've actually traded it: trade count, net P&L, win rate, average R and your best hour. Every symbol shows whether you've traded it, and turning on Show my trades plots your entries and exits on the chart using bar data you've uploaded.
Backtesting
Test a setup before you risk money on it.
Upload bar data from your own platform, then build a strategy from blocks like EMA crosses, RSI, breakouts and session times, with your stop, target and position size. Run it to see net P&L, win rate, profit factor, drawdown and every trade, then replay it bar by bar. Backtest trades stay separate from your live journal and discipline score.
AI Trade Review
Upload a chart screenshot and get an AI trade review
Trakfinity's AI trade review reads the chart screenshot from your trade — instrument, timeframe, entry, stop loss, take profit and exit — then reviews how you executed it against your own strategy rules and trade history. It is a post-trade review of your own trading, never a signal or a forecast.
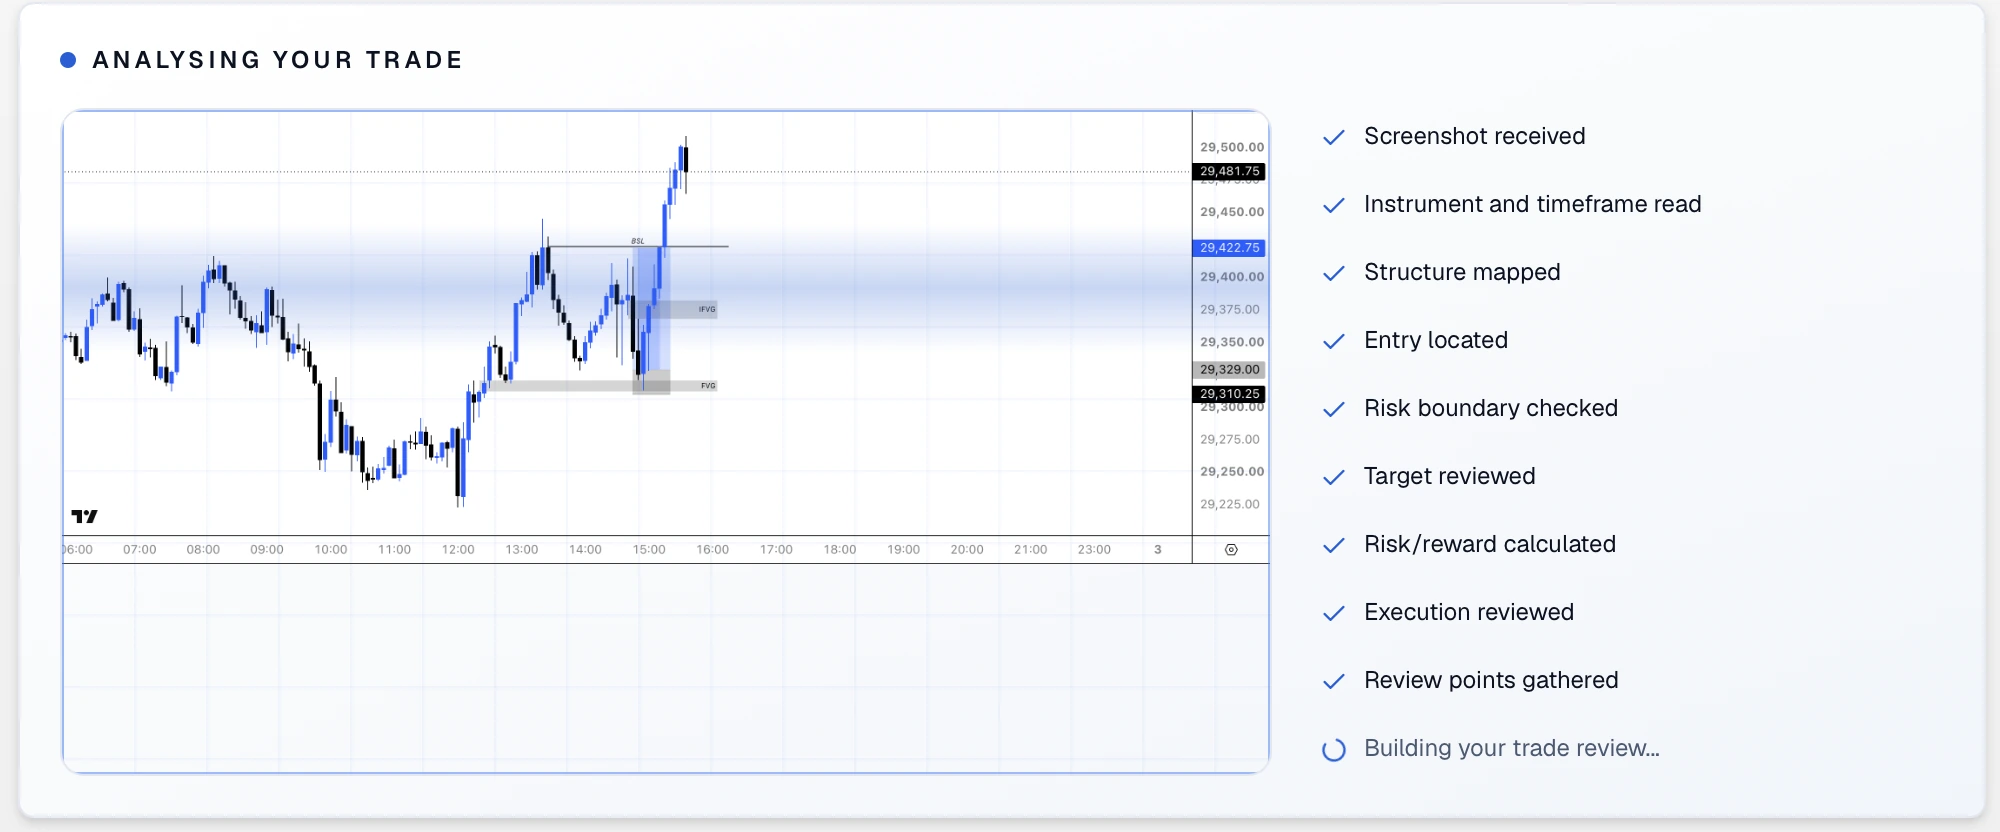
Instrument & timeframe
Reads the market and chart interval shown in your screenshot.
Market structure
Maps the visible trend, swings and important price zones.
Entry
Locates where the trade was entered against the setup.
Stop & risk boundary
Checks the stop placement and the risk taken on the trade.
Target
Reviews the intended target against the chart structure.
Risk/reward
Calculates the potential reward relative to the defined risk.
Execution
Assesses how the entry, management and exit were handled.
Review output
Turns the findings into clear, practical review points.
Upload your chart screenshot
Drag in, paste or upload up to three chart images from desktop or phone straight after the trade closes.
AI reads the chart
A vision model extracts the instrument, timeframe, direction, entry, stop loss, take profit and exit printed on the image.
Compared with your logged trade
Detected values are checked against the trade in your journal. Anything read incorrectly can be corrected and re-analysed in a click.
A structured trade review
Risk-to-reward, R multiple and outcome are calculated deterministically, then the AI writes observations on entry timing, trade management and exit quality.

Log a live trade in seconds with the Trade button
When a setup appears mid-session you do not have time to fill in a full journal entry. The live trade screen captures the essentials — checklist, risk, position size and direction — while the trade is still running.
- The blue Live trade button sits in the desktop header, the sidebar and the centre of the mobile task bar.
- Tick your entry checklist criteria, set risk as a percentage or a fixed amount in your own currency, and get position size instantly.
- The trade is saved as an open position you can track, edit and close when it is done.
- Exits, notes, screenshots and the AI review can all be filled in after the session.
Trakfinity analyses only the trades and screenshots you provide. It does not give financial advice, recommendations or signals, and trading carries risk of loss.
The journal
A complete trading journal, not a list of results
A professional trade journal records the decision, not only the outcome. Trakfinity keeps the full context of every trade in one record, then turns that history into trading statistics you can act on.
What you record per trade
Each entry in your trading log captures the numbers and the reasoning behind them, so a review months later still makes sense.
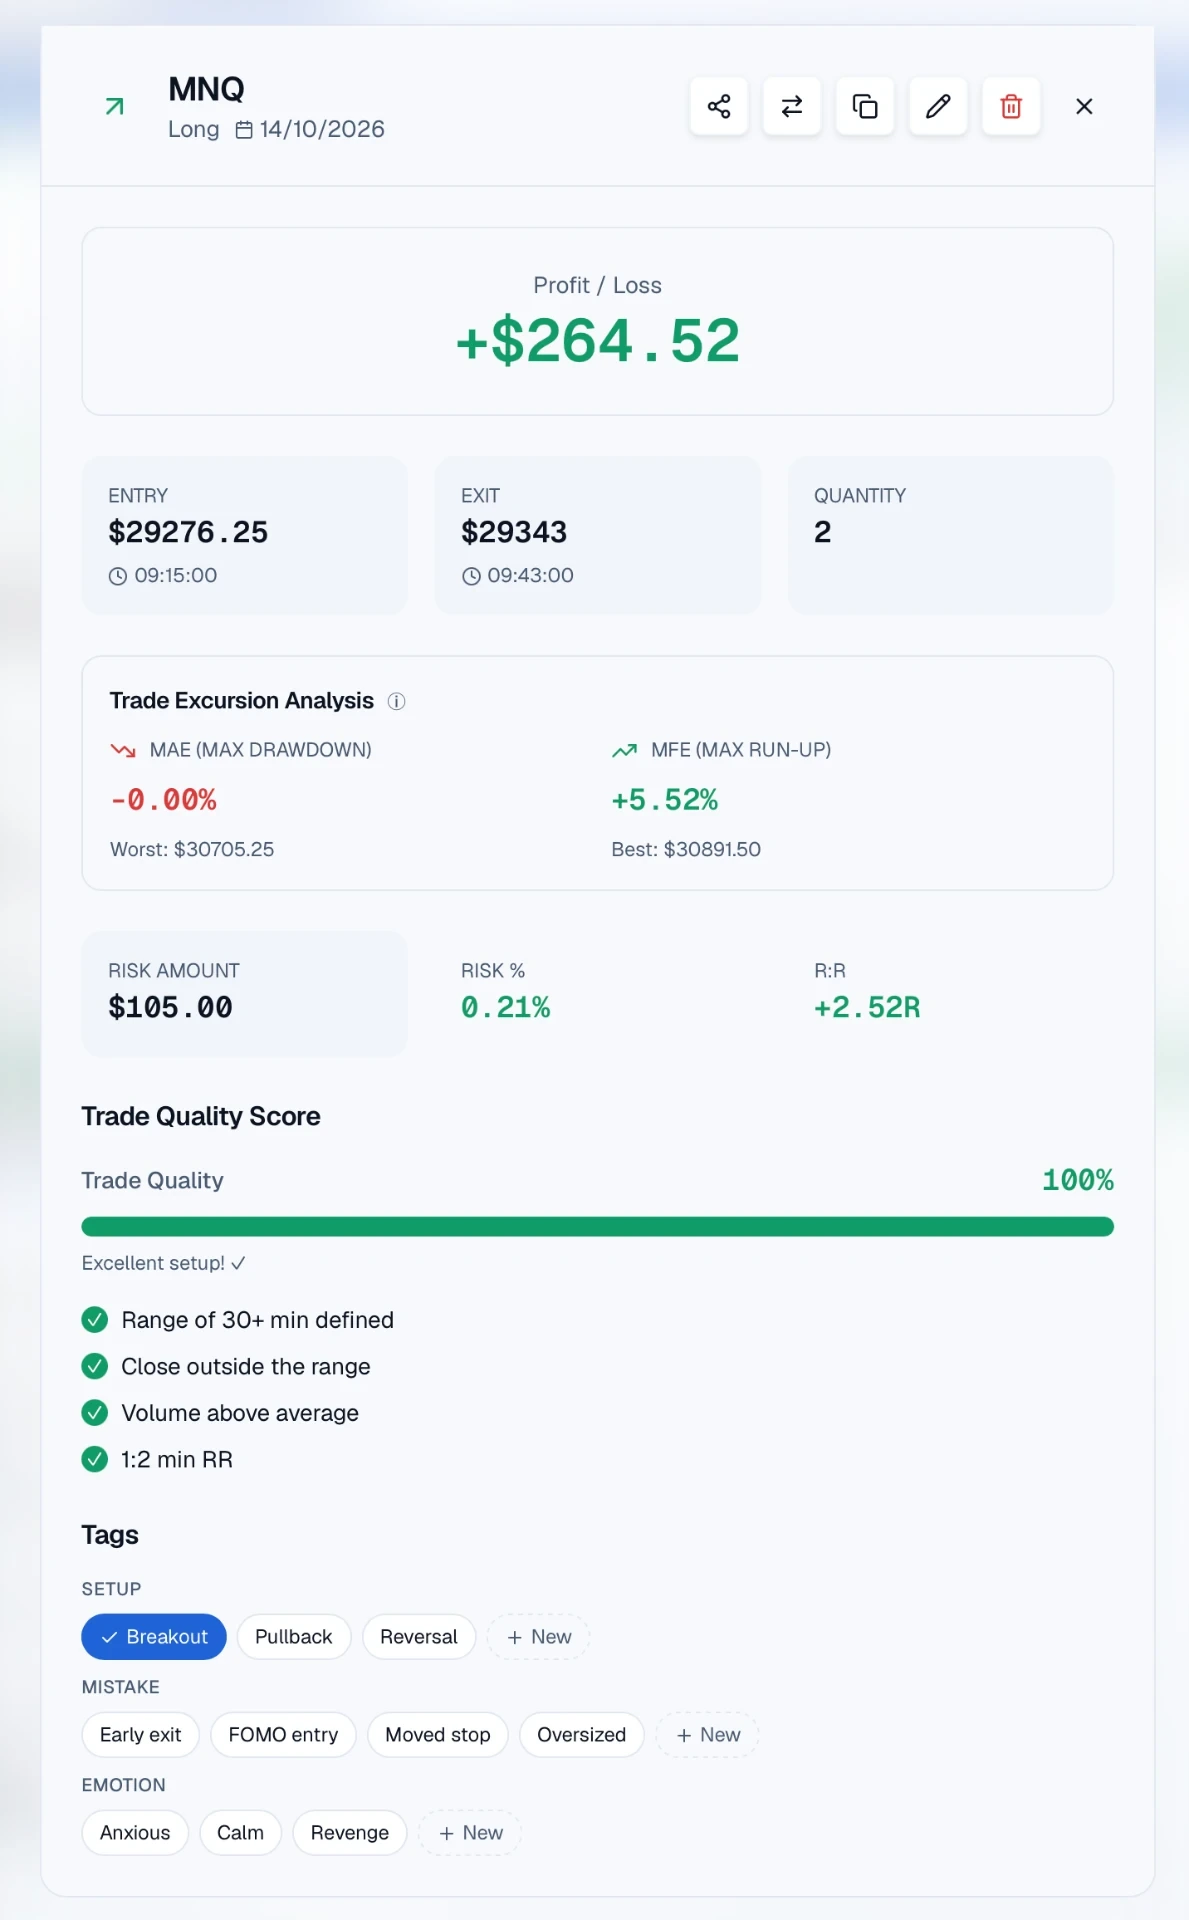
- Entry and exit price, date and time
- Direction, position size and contract multiplier
- Stop loss, take profit and risk per trade
- Risk-to-reward ratio and realised R multiple
- Market, symbol, timeframe and session
- Strategy, setup and trade reasoning
- Commissions and fees in net P&L
- Chart screenshots before and after
- Written notes and emotional state
- Pre-trade checklist results and score
What Trakfinity measures
Your trade data is calculated for you — trading performance analysis, risk metrics and behavioural patterns update as soon as a trade is logged.
- Net profit and loss after costs
- Win rate, average win and average loss
- Profit factor and expectancy
- Equity curve, drawdown depth and recovery
- Average risk and risk distribution
- Performance by session, symbol and setup
- Day-by-day results on the trading calendar
- Discipline score graded A+ to F
- Consistency and overtrading heatmap
- Capital progress against your profit target
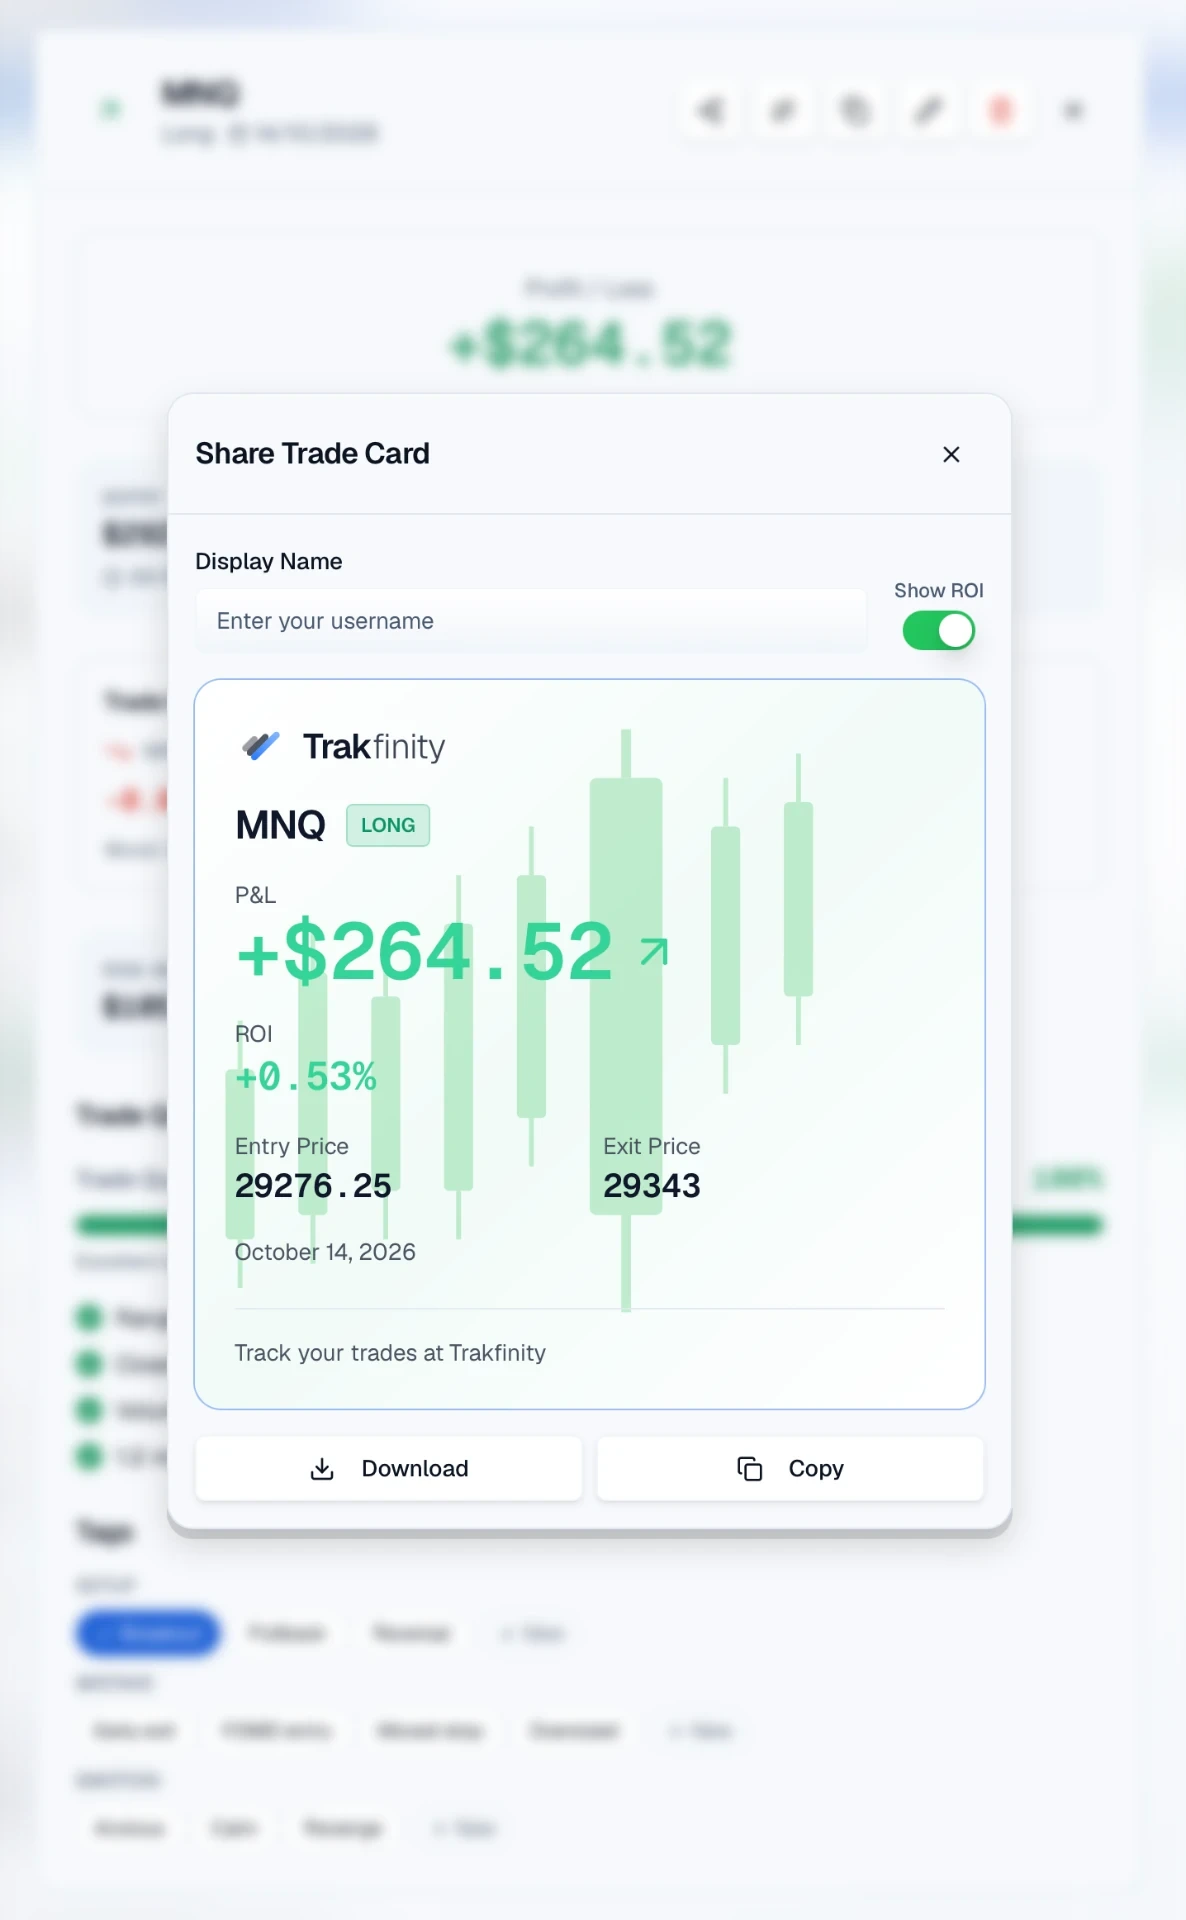
Risk management and position sizing
Risk per trade is calculated from your stop loss, position size and account capital, so you can see the real exposure behind each idea rather than estimating it. Average risk, risk-to-reward distribution and outlier flags show when sizing drifts away from your plan, and drawdown tracking makes both daily and maximum drawdown visible while it is still recoverable. For funded and evaluation accounts, that risk view sits next to the account rules you are trading under.
Trading psychology and discipline
Revenge trading, overtrading, FOMO entries and hesitation are habits, and habits show up in data. Tag the emotional state behind a trade, complete a pre-trade checklist, and Trakfinity checks your own trading rules every trading day. Both feed your 0–100 discipline score, graded A+ to F.
Everything in one place
The full toolkit for deliberate traders
Tightly built modules that turn scattered trades into a repeatable process you can audit, refine and trust.
AI Trade Review
Every trade read back to you in plain English.
AI reviews entry, management and exit, then names the single change with the highest expected payoff.
Trading Journal
Screenshots, notes, tags and checklist results attached to each trade.
Chart images, thesis, emotion tags and checklist results live on the same record, searchable forever.
Equity Curve
See the shape of your edge, not just the balance.
Drawdown depth, recovery speed, profit factor and expectancy plotted across every account you run.
Performance Dashboard
One screen that answers 'how am I actually doing?'
Net P&L, fees, win rate, R multiples and streaks update the moment a trade is logged.
Risk Analytics
Catch size creep before it costs you the month.
Average risk, R:R distribution and outlier flags show when position sizing drifts from your plan.
Trading Psychology
Tie emotion to outcome with real evidence.
Tag revenge trades, hesitation and FOMO, then see exactly what each state costs you in R.
Discipline Score
A single number for how well you followed your plan.
A 0–100 score graded A+ to F, built from the rules you keep and your checklist completion.
Smart Statistics
Session, symbol, day and setup breakdowns.
Find the two setups paying for everything else, and the ones quietly draining the account.
CSV Imports
Bring your entire history in minutes.
Map columns once and import thousands of historic fills from a broker export or spreadsheet.
Direct Broker Connections
Connect Binance, Bybit or OANDA with encrypted API keys.
Start your free trial to connect a brokerBroker connections are available after you sign up.
Trades sync automatically from your broker about every 4 hours, with no CSV needed. Keys are encrypted, only the last four characters are ever shown, and duplicates are skipped on every sync.
Prop Firm Tracking
Stay inside evaluation rules automatically.
See how prop firm journalling worksTrack drawdown limits, daily loss caps and target progress per funded or evaluation account.
Trading plan
Entry checklists and automatic rules, clearly separated.
Set criteria for each setup and review the rules checked against your logged trades.
Markets
TradingView charts for stocks, futures, forex and crypto — with your own trades on the symbol.
Review your trading record alongside charts and prices by TradingView.
Backtesting
Test a setup on historical bars and replay every trade.
Upload your own bar data, build a strategy from blocks and review hypothetical results separately from your live trades.
Goal Tracking
Profit targets with honest progress.
Set capital goals and watch progress, remaining distance and pace toward the target in real time.
How it works
Three steps from scattered notes to a real process
Import your trades
Sync a CSV export, connect Binance, Bybit or OANDA directly with an API key, or log trades manually in seconds. Screenshots, notes and rules attach as you go.
AI analyses everything
Trakfinity scores execution, flags repeated mistakes and surfaces the patterns behind your results.
Become more consistent
Follow a clear weekly review loop, watch your discipline score climb and let the equity curve follow.
Discipline score
One number that tells the truth about your process
A 0–100 score graded A+ to F: 70% rules kept, 30% checklist completion, over your last 20 trading days.
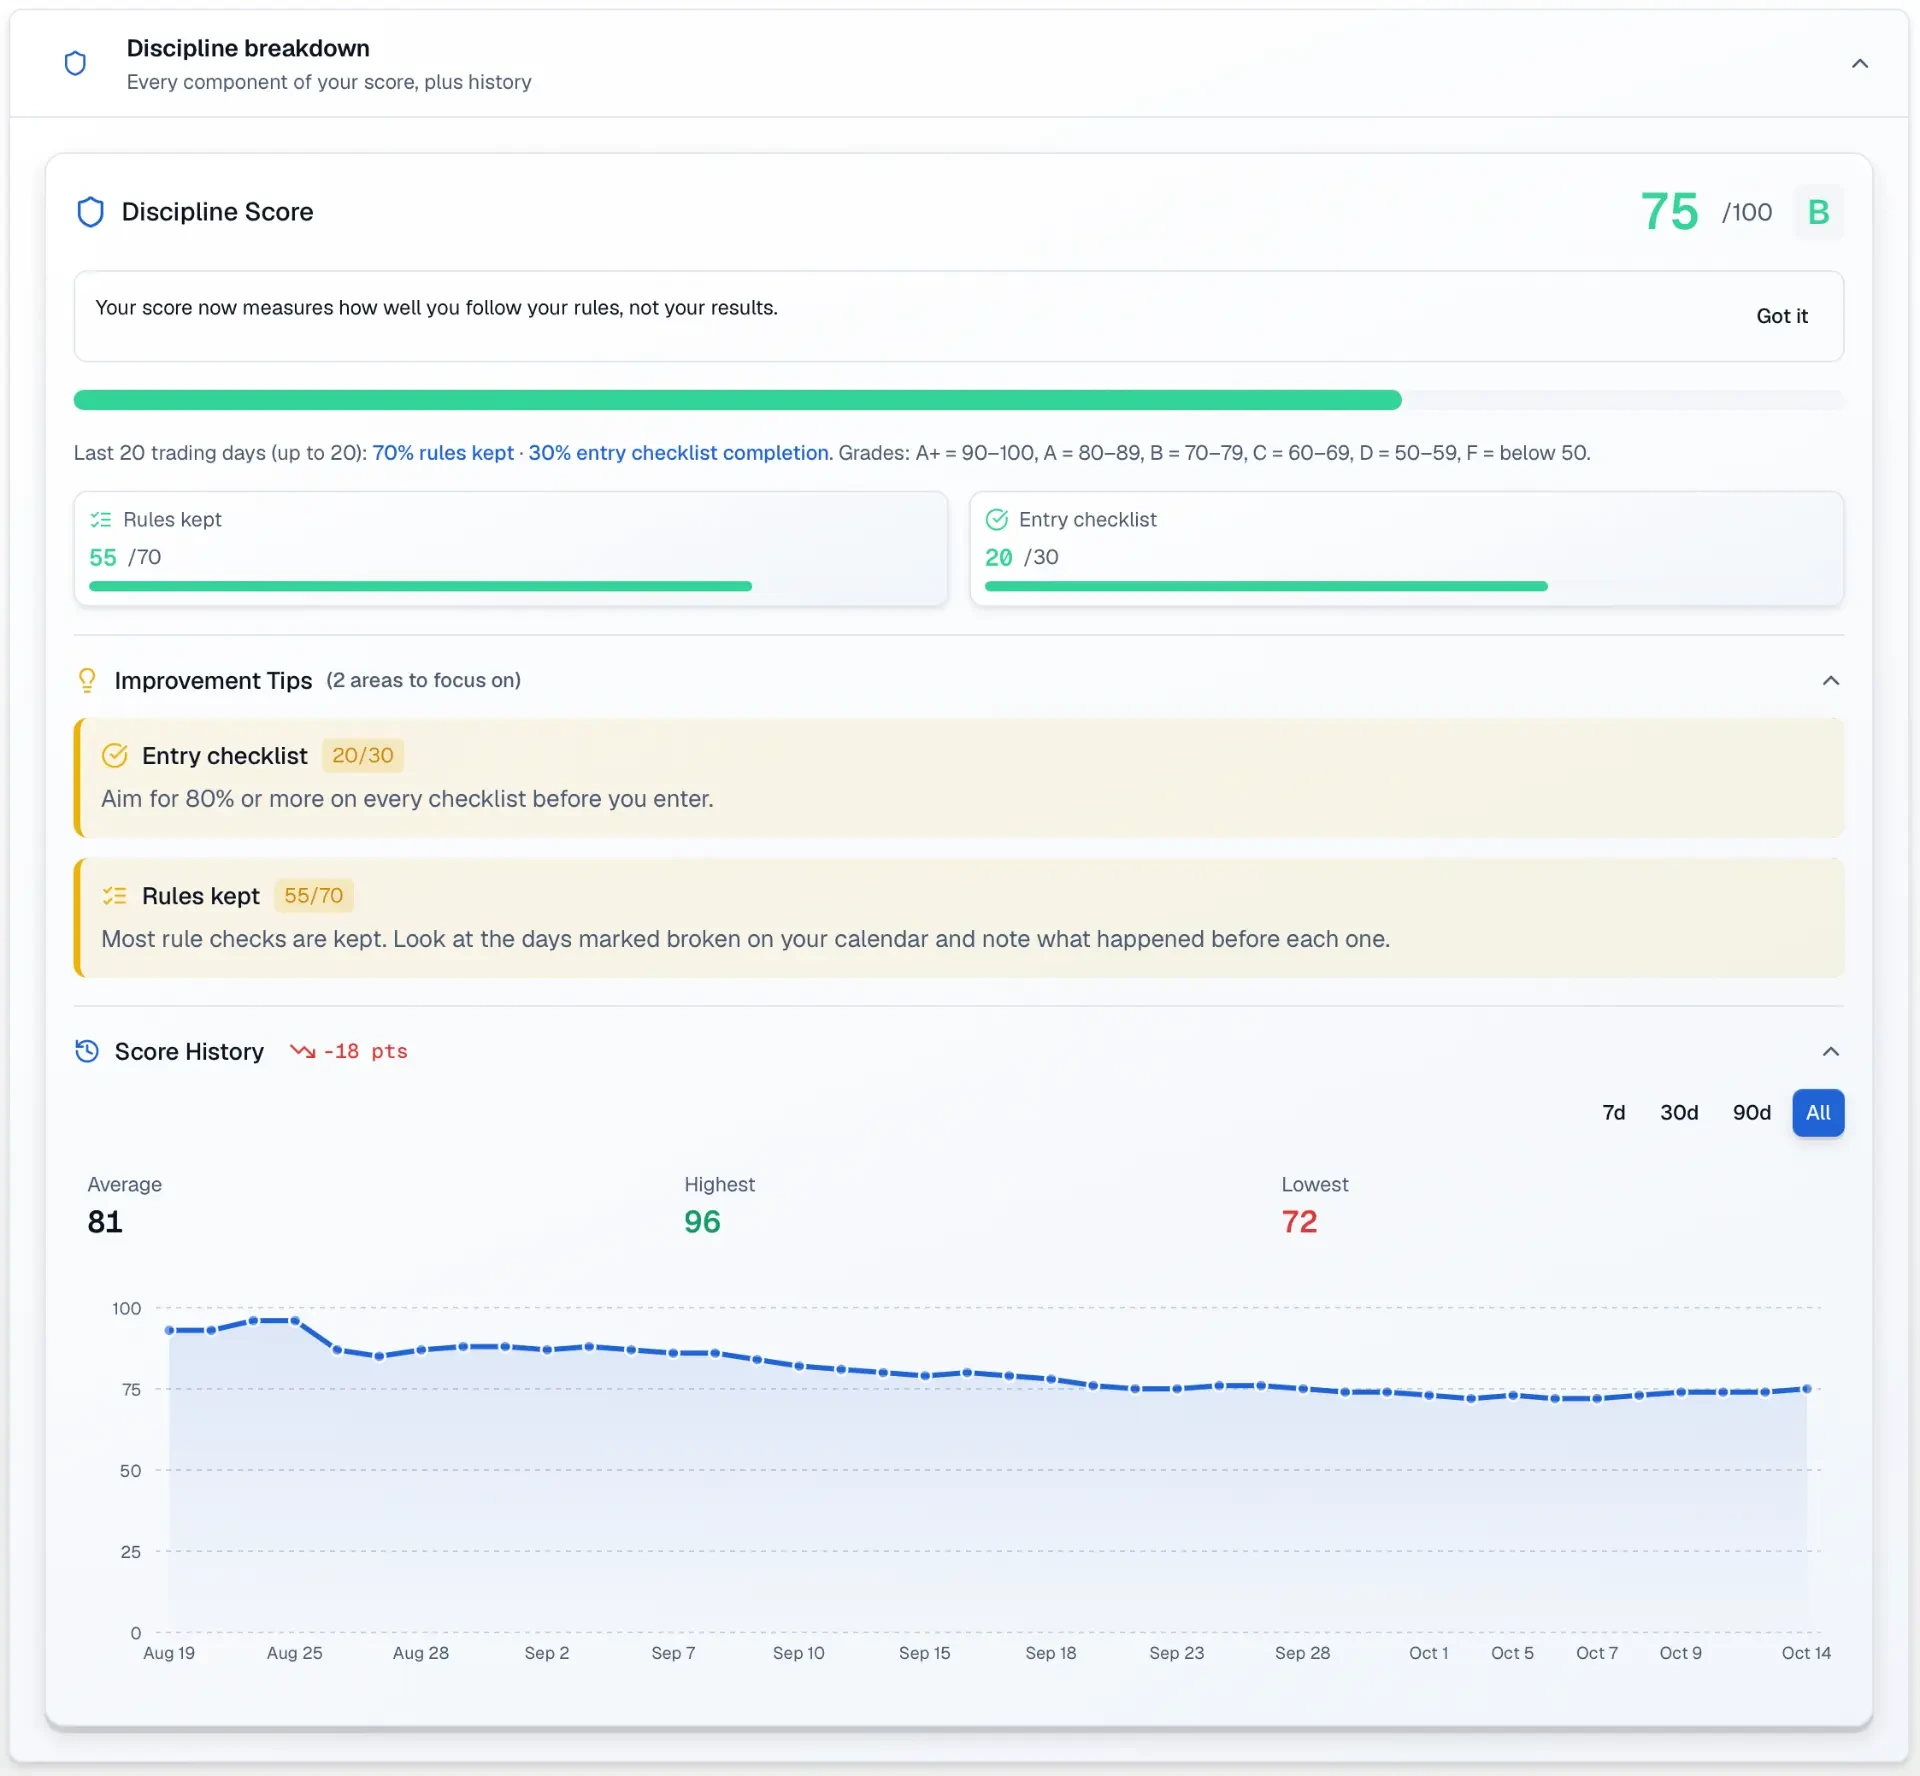
Rules kept: 55 / 70
Up to 70 points: the share of your own rule checks you kept over your last 20 trading days. Here, 78.57% kept earns 55.
Trakfinity AI
A trading coach that has read every trade you've taken
Not generic advice. Analysis grounded in your own history, your own rules and your own psychology.
AI Coach
38 trades · last 90 days
Revenge trades
−$412.509 trades were opened within 15 minutes of a loss. They did $45.83 worse than your other trades.
38 trades · High confidence · 4.1R
Losses beyond planned stop
−$268.006 trades lost more than the planned 1R, costing $268.00 beyond your stops.
34 trades · High confidence · 2.7R
Weak time-of-day window
−$190.209 trades opened 14:00–16:00: −$21.13 avg per trade, −$190.20 total. At other hours, trades average a gain.
38 trades · Medium confidence · 1.9R
Best edge
+$530.00Your Pullback setup has the highest expectancy: $48.18 per trade versus $9.10 elsewhere.
38 trades · Medium confidence · 5.3R
Example data, shown in USD. Your cards come from your own closed trades once you have at least 10.
AI trade reviews
A written review of every trade: what worked, what didn't, what to repeat.
Mistake detection
Early exits, moved stops, oversized entries — named and counted.
Psychology analysis
Emotional patterns matched to your P&L so bias becomes measurable.
Pattern recognition
Which setups, sessions and symbols genuinely carry your edge.
Risk suggestions
Concrete sizing and stop guidance based on your own distribution.
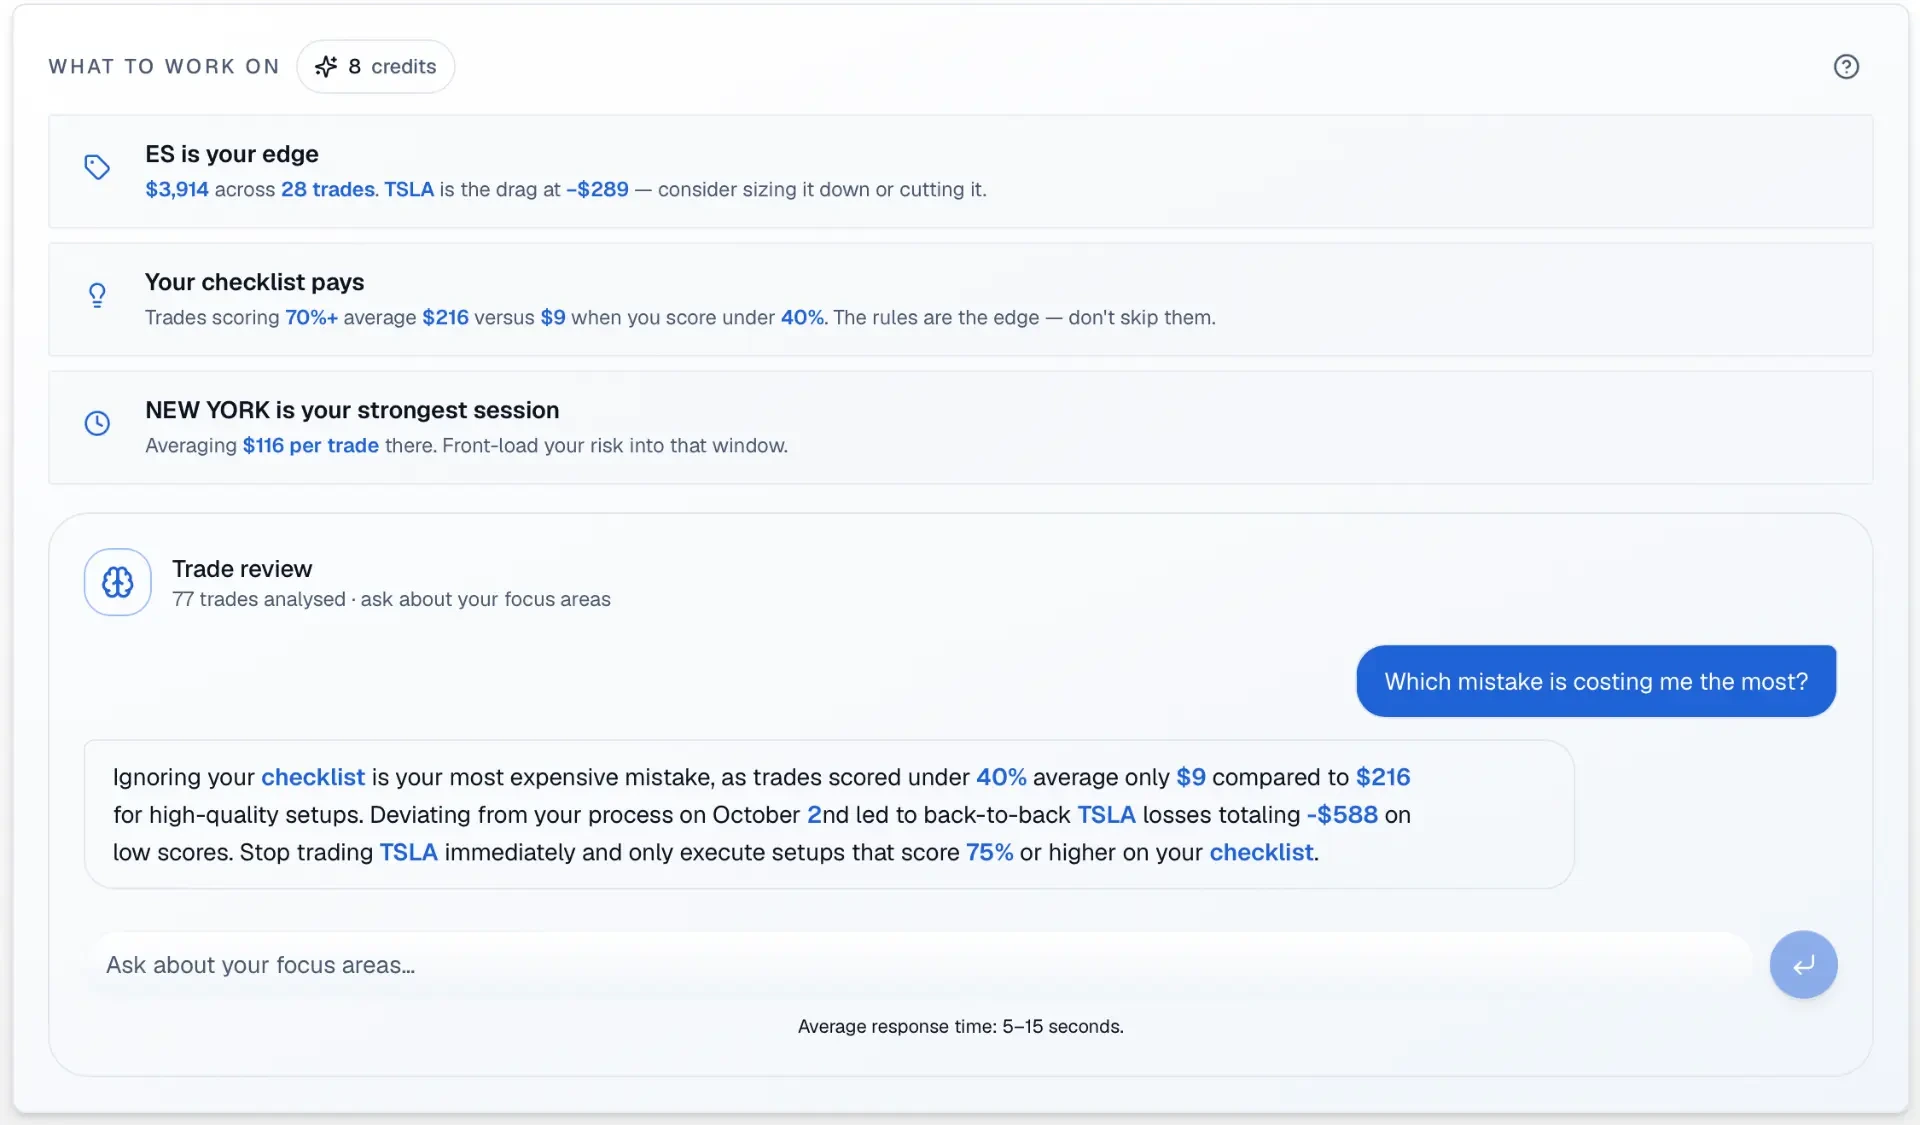
Coach summary
One click turns your coach cards into three plain sentences. Only the card summaries are sent to the AI, never your trades.
Who it's for
Built for day, futures, forex, crypto, stock and funded traders
Trakfinity is one trading journal and performance tracker for every market you trade — the workflow stays the same, the analytics adapt to the instrument.
Day traders
Log intraday executions in seconds and review them by session, symbol and time of day so you can see which hours of the day actually pay you.
Futures traders
Contract multipliers, commissions and fees are handled in the P&L maths, so futures trades are journalled with the same accuracy as the fill on your platform.
Forex traders
Track pairs and sessions across London, New York and Asia, with multi-currency accounts converted into one base currency for a single view of performance.
Crypto traders
Journal spot crypto trades and keep a watchlist of the coins you follow, with the same analytics, risk metrics and discipline scoring as every other market.
Stock traders
Record equity and index trades, tag the setup and strategy behind each one, then compare win rate and expectancy across the tickers you trade most.
Funded and prop firm traders
Run each evaluation or funded account separately and follow drawdown, daily loss and profit target progress against the rules you have been given.
Prop firm trading journalExperienced traders
Dig into trading statistics — profit factor, expectancy, R multiples, average win and loss, drawdown depth and recovery — across your full trade history.
Developing traders
Start a trading journal from your first trade, learn from your own data instead of guesswork, and build the review routine before the account gets bigger.
Funded trading
Built for funded and prop firm traders
Trading a funded account means trading someone else's rules: drawdown limits, daily loss caps, consistency expectations. Trakfinity is where you organise and review that process — it is an independent journal, not affiliated with any prop firm.
Drawdown you can see coming
Follow daily loss and maximum drawdown per account, so the numbers your funded challenge is judged on are in front of you before the next trade, not after it.
Target progress per account
Set the profit target for each evaluation or funded account and track distance remaining, pace and capital progress separately from your personal accounts.
Consistency and rules
Prop firm rules reward process. Checklists and the discipline score show whether your risk per trade, session choice and trade frequency stayed inside your own plan.
Beyond the spreadsheet
A professional alternative to a trading spreadsheet
Excel and Google Sheets trading journal templates are a reasonable start. They stop being useful once you want trading analytics, behavioural feedback and a review process you will actually keep.
Starting a trading journal as a beginner
If you are learning to trade, the most valuable data you will ever study is your own. Record every trade from the start — what you saw, the risk you took, the rules you followed and how you felt — and within a few weeks you have evidence instead of impressions. Trakfinity gives you the structure: a form that prompts for the right fields, a checklist to complete before entry, and a dashboard that explains what your first fifty trades are telling you.
For traders who want better data
With a longer history, the questions get sharper: which setup carries the account, which session leaks money, whether drawdowns come from sizing or from selection, and how behaviour changes after a loss. Import your existing history by CSV, then work through strategy, session, risk and behavioural breakdowns against your full trade record rather than the last few trades you remember.
Our story
We didn't build Trakfinity because the market needed another trading journal.
We built it because we needed one.
We're building Trakfinity from London — one of Europe's major financial centres, and a city surrounded by the markets that shaped much of what we're building. Between us, we've been trading funded and live accounts since 2020.
That experience didn't come with a shortcut. It came with mistakes, drawdowns, rebuilt rules and a lot of reviewing. And through all of it, one thing never stopped being harder than it should have been: understanding our own trading.

Built in London, used daily
The same dashboard we open after our own sessions
The spreadsheet problem
If you've ever finished a session knowing you should journal, then sat in front of a spreadsheet trying to remember what actually happened, you'll know where this came from. Excel, Notion, notes, screenshots, platform exports — each one worked on its own, none of them worked together.
Recording wasn't the hard part
Logging P&L and taking screenshots was never the obstacle. Turning that into something useful was. Which setups genuinely performed? Which sessions carried the results? Where did the mistakes repeat? Did we follow our own rules, or did the outcome just happen to be kind?
So we stopped accepting it
We didn't need another spreadsheet. We needed a system built around the trader: trade tracking, performance analytics, risk, discipline and review connected in one place. That was the beginning of Trakfinity.
We didn't want to build a platform that tells you how to trade. We wanted one that helps you understand how you trade.
A journal helps you see what you're doing right and wrong before habits become ingrained.
A journal stops being about remembering trades and becomes about extracting information from hundreds of decisions.
Inside strict risk and drawdown parameters, consistency and process matter as much as finding an entry.
How Trakfinity happened
2020
Started trading seriously
We began building real experience in the markets — funded evaluations, live accounts, and the slow work of turning ideas into a repeatable process.
Built by traders.
Used by traders.
Trakfinity isn't something we built and handed off. It's part of our own process, so the product keeps evolving around the problems we actually run into. Since building it, having our decisions, results and behaviour in one place has helped us spot patterns that were much harder to see across spreadsheets and notes — it has made our process more measurable, not guaranteed.
Markets don't only test your strategy. They test your ability to follow it. Trading is difficult, mistakes happen, consistency takes time, and data never removes uncertainty. Trakfinity isn't designed to make trading easy — it's designed to make your own trading easier to understand.
Maybe you're taking your first steps and trying to work out what a proper journal should even look like. Maybe you've traded for years and have hundreds of trades scattered across spreadsheets, screenshots and platforms. Or maybe you're managing significant funded capital and have realised that the more you trade, the more valuable your own data becomes.
Wherever you are in that journey, the principle is the same: you can't improve what you don't measure.
We built Trakfinity because we needed it ourselves. Now we're building it for anyone who wants to take their trading process more seriously — whether you're placing your first trades or managing significant funded capital.
7-day free trial; a card or another supported payment method is required at checkout; your first £5/month charge (or the local-currency equivalent shown at checkout) is due when the trial ends; cancel any time before then from your account settings.
Pricing
One plan. Everything included.
No tiers, no feature gates, no annual lock-in. Cancel any time from your account.
Trading without Trakfinity
$0
and the cost of repeating mistakes
- Spreadsheet you maintain by hand
- No behavioural feedback
- No AI review or pattern detection
- Guesswork instead of evidence
Trakfinity Pro
All features included7-day free trial, then billed monthly · cancel any time · secure checkout by Stripe
- Unlimited trades and journal entries
- AI trade reviews and weekly summaries
- Discipline score: 70% rules kept, 30% checklist completion, over your last 20 trading days
- Equity curve, drawdown and expectancy
- Risk, session and setup analytics
- Futures, forex, stocks and crypto
- Multi-account, multi-currency support
- CSV imports and screenshot uploads
- Live checklists and trade calendar
- Stock, crypto and financial news trackers
7-day free trial; a card or another supported payment method is required at checkout; your first £5/month charge (or the local-currency equivalent shown at checkout) is due when the trial ends; cancel any time before then from your account settings.
FAQ
Frequently asked questions
A trading journal is a structured record of every trade you take — entry and exit, position size, risk, stop loss, the setup you traded and the reasoning behind it. Kept consistently, it turns individual trades into a data set you can analyse for patterns in both your strategy and your behaviour.
Stop guessing.
Start trading with data.
Join the traders who review every position, protect their capital and let evidence — not emotion — drive the next entry.
7-day free trial; a card or another supported payment method is required at checkout; your first £5/month charge (or the local-currency equivalent shown at checkout) is due when the trial ends; cancel any time before then from your account settings.